
If you’re looking to start a permaculture garden but are a little confused about the climate, and how that relates to your growing plans, I’m here to help.
In this article, you can read about some of the different climate factors and zones you might find in the United States, and how this knowledge will affect your permaculture plans.
Through an explanation of climate factors and climate zones, you will learn:
- how to decide which types of plants to buy and grow, and when to plant them
- which permaculture installations might suit your site, and which might not
- how to choose animal breeds for your site according to climate predictions
- which types of buildings and building materials are suited to different climate types
Climate zones can be explained in a few ways… This article will discuss three ways:
- studying your location
- learning the USDA Hardiness Zones
- using the Köppen climate classification to determine the effects of macroclimatic biomes
Ideally, you’ll use all three systems to make a decision about what to grow, build, and sell in your homestead permaculture system.
Once the macroclimatic factors have been explored, you may need to consider the microclimate of your site in particular to make even more advanced decisions, some of which will be covered by a later article about permaculture site design.
Microclimates refer to the climate factors of a specific or local area, such as an individual hill, valley, farm site, house, building, or even a single garden bed – and how these individual sites or installations may differ from the climate of the surrounding region.
When designing your permaculture garden, be sure to research your microclimates too, as described later in this article.
Table of Contents
Climate Factors of Importance
Weather Spark is a useful way to discover the recent climate history of your region.
You should definitely open this website, and search your location in there, as you will be able to link the information presented in this article directly to where you live and work.
If it does not find your exact location, you should search for the nearest location to where you live or work, so that there is as little variance as possible between the climate factors of your region and the region examined by the site.
WeatherSpark can give you climate data sourced from the years 1980 – 2016, which satisfies the guidelines of climatologists’ recommendations of using at least a thirty-year period to study climate.
It also means that recent changes to climate will be reflected in the report, rather than if it had used averages from 1960 to 1990, such that you may find on other sites.
The site also gives you percentile data, which is useful in how it displays both what is typical (25th to 75th percentiles), what is unusual, but still not rare (10th to 25th and 75th to 90th percentiles), and what is highly unexpected and atypical weather (1st to 10th and 90th to 100th percentiles).
If these data points sound difficult to understand, then you can consider today’s weather as being in one of three classes: normal, unusual, and rare.
WeatherSpark gives you the following climate information for your site:
- Overall summary chart
- Air temperature
- Cloudiness
- Precipitation
- Sunlight
- Humidity
- Wind
- Tourism factors
- Growing Season
- Solar Energy
- Topography
Depending on your permaculture plans, some or many of these factors might be highly influential in planning your enterprise.
For example, if you make a living selling vegetables, the growing season is possibly the most critical data point to study…
Where I live in Central Texas, the growing season is defined as being from February 27th to November 27th.
This means that I am unlikely, in a typical year, to experience freezing temperatures after the first date and before the second.
I might try waiting a few extra weeks in February “just to be safe”. However, many vegetables will struggle to flourish in the warm periods of summer here, so I could also make an argument for starting earlier in the springtime.
In the temperature analysis, the ‘hot’ season is defined as starting on June 1st, so as long as I have completed the majority of my harvesting on or around this date, it shows me that I can grow vegetables with a maximum of a 95-day growing cycle.
If the plant growth cycle of my chosen species is longer than 95 days, I may have to take a risk and start earlier.
If you collect rainwater in tanks, it is important to look at the precipitation section to determine when your water will be flowing in, and if you use your rainwater to irrigate, when you are most likely to be in need of the rainwater.
If you know your roof-surface catchment area, and you research your precipitation averages, you will be able to define, based on your location average, how much rainwater you might capture in a given month.
The average precipitation for my location in March is 2 inches, and my rooftop has an area of 1,250 square feet.
This allows for a total potential capture of up to 1,558 gallons of water over the month of March, which would likely be less, but yield increased water quality, if I used a first-flush system.
One more example worth mentioning in detail is solar energy collection. WeatherSpark uses the data of sunlight hours, solar elevation, and cloudiness to create a formula for solar energy capture.
If a typical-sized solar panel is 17.5 square feet, then, in my location, the estimated solar energy captured will be at an average minimum of 5.04 kWh per panel per day (during December), and an average maximum of 11.38 kWh per panel per day (during June).
This data will help you decide how many panels you may like to install in order to suit your home’s energy use needs.
USDA Hardiness Zones
One familiar resource that many gardeners may be aware of is the USDA Hardiness Zones map, in which the US Department of Agriculture created a set of temperature zones from 1 to 13, where 1 has the lowest minimum temperature, and 13 has the highest minimum.
Zones 1-13 are instructive in how they describe one single climate variable – that of the lowest air temperature you’re likely to encounter in a given year.
The coldest zone, zone 1, refers to minimum temperatures between -60 and -50 degrees Fahrenheit (-51 to -45 Celsius).
Each zone increases incrementally by 10 degrees Fahrenheit, so that the hottest zone, zone 13, has a minimum temperature range between 60- and 70-degrees Fahrenheit.
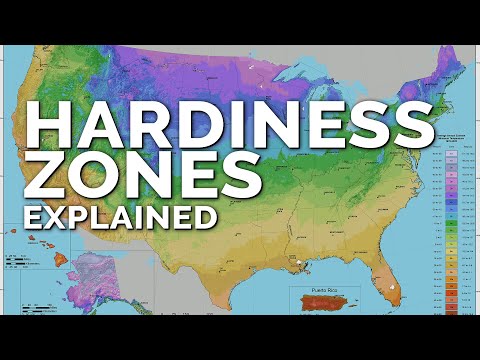
To add more detail to the scale, zones can be designated by their numeral and the letter (a) or (b), depending on whether they are colder or warmer.
In this way, zone 13(a) refers to a minimum between 60 and 65 degrees, and zone 13(b) to 65 to 70 degrees.
Plants are often rated by the lowest hardiness zone they can tolerate, in that the hardiest plants could tolerate zone 0(a) which means that they are likely to survive even below negative 65 temperatures.
Meanwhile, the least hardy plants, zoned 13(b), may only survive in temperatures above 65 degrees Fahrenheit (18 Celsius).
Examples of some of the hardiest plants include sea holly, amaryllis, and birch trees – these are expected to survive even in USDA zone 2.
Meanwhile, plants like the Mexican Flame Vine, Throatwort, and the Triangle Palm tree are rated for zone 13, which means that they can only be grown in very select outdoor locations in the country.
In my home zone, the rating is 8(b), which corresponds to a 15 to 20 degrees Fahrenheit minimum, meaning that I might be advised to grow glossy abelias, yarrow, or Japanese maple trees among many others.
Here is a list of typical cities that represent climate zones, to give you an idea of the system:
- Zone 2: Fairbanks, Alaska
- Zone 4: Minneapolis, Minnesota
- Zone 6: Chicago, Illinois
- Zone 8: San Antonio, Texas
- Zone 10: San Francisco, California
- Zone 12: San Juan, Puerto Rico
If you look at the back of a seed packet, you may find instructions that mention the hardiness zones that also give you an idea of when to plant the seeds.
Following these instructions can be useful to avoid frost. However, the single biggest disadvantage of USDA zones is that, by themselves, they only determine whether your plant will or won’t die of cold and frost.
These zones don’t help you plan for sunlight hours, heavy rains, or temperatures that are too hot for your plants to thrive.
If you’re interested in the science behind a climate zone, or for a more complete picture of climate zones and their associated biomes, you will need to turn to Köppen climate classification zones.
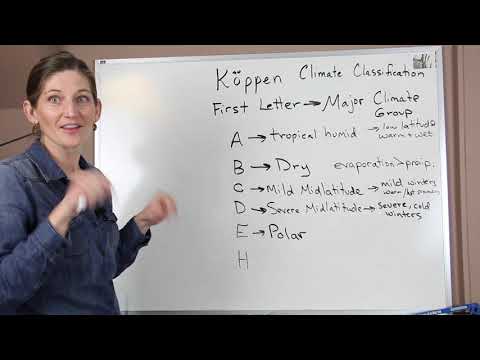
Köppen Climate Classification Zones
One scientifically respected system of climate analysis is the Köppen-Geiger system, first used in 1884. It proposed five broad climate types, each with subtypes of its own for variations and biomes. Below follows a summary of the types of zones:
- Tropical Climates
- tropical rainforest
- tropical monsoon
- tropical savanna variations
- Dry Climates
- hot desert
- cold desert
- hot semi-arid
- cold semi-arid climate zone subtypes
- Temperate Climates
- humid subtropical
- temperate oceanic
- subpolar oceanic
- monsoon subtropical
- subtropical highland
- hot-summer Mediterranean
- warm-summer Mediterranean
- cold-summer Mediterranean climate zone subtypes
- Continental Climates
- hot-summer humid continental
- warm-summer humid continental
- subarctic
- extreme subarctic
- monsoon hot-summer humid continental
- monsoon warm-summer humid continental
- monsoon subarctic
- monsoon extreme subarctic
- Mediterranean humid hot-summer
- Mediterranean humid warm-summer
- Mediterranean subarctic
- Mediterranean extreme subarctic climate zone subtypes
- Polar and Alpine Climates
- tundra
- ice-cap climates
While it is not all that important to know all the zones in detail, it would be useful to recognize the broad 5 types given as headings above, as well as knowing which individual subtype pertains to your home zone.
Each zone is classified by minimum and maximum temperatures, humidity, and rainfall. The terms tropical, subtropical, subpolar, and subarctic all refer to latitude.
Monsoon, savanna, desert, humid, and aridity are references to the amount of moisture in the air, rainfall, and the time of year to expect both. If you want to find your own climate zone or a zone near you, you can use this interactive map.
Of the thirty possible subtypes of climate zones, twenty-nine exist within the borders of the United States. Here is a rough idea of the US’s geographic regions by broader climate type:
- North-East Continental US: Humid Continental Warm and Hot Summer
- South-East Continental US: Humid Subtropical
- South Florida: Tropical Rainforest, Tropical Savanna
- Puerto Rico: Tropical Rainforest, Tropical Savanna
- Mid-Western US, depending on Latitude and Altitude: Cold Semi-Arid, Humid Continental
- Arizona and Nevada: Hot Desert
- Pacific Coastline: Mediterranean
- Alaska: Subarctic, Tundra
- Hawaii: Tropical Rainforest, Tropical Savanna
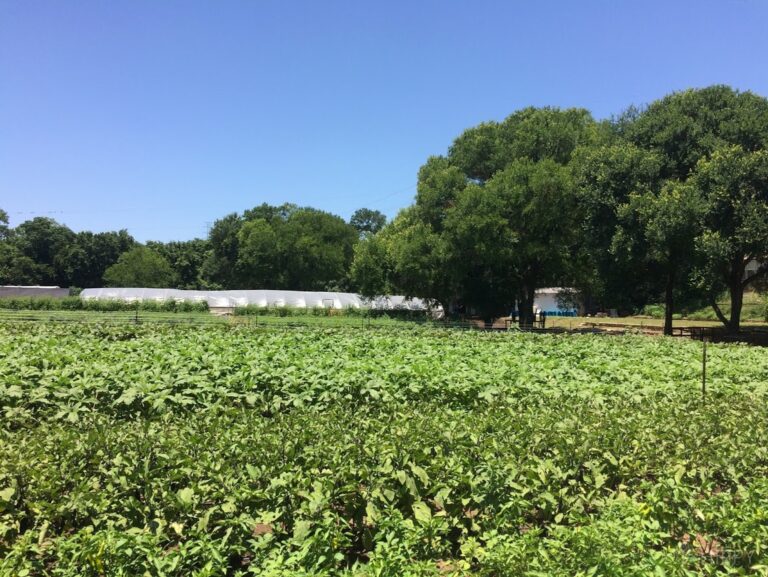
The climate zone in which I live in is classified as Humid Subtropical, which is the largest climate region in the United States.
The definition of this zone is that its coldest winter temperatures are around 29 degrees Fahrenheit, while its warmest month reaches at least above 72 degrees Fahrenheit.
Furthermore, at least 8 months have an average temperature over 50 degrees Fahrenheit. Summers are hot, long, and humid. Brief thundershowers during summer are common, and winters are mild and sometimes dry.

The Influence of Microclimate
All the information presented thus far is about your macroclimate, which is somewhat easier to research than your microclimate.
The reason for this is that each site is different, and so your findings about microclimate are more likely to be based on intuition and common sense than on data.
It may be helpful to talk to someone who has lived on or near your site for many years about whether they think your individual site is colder or warmer, windier, cloudier, or rainier than the surrounding area, for example.
People’s folk wisdom can be useful against the backdrop of thoroughly researched data, and there are often good reasons to back up their intuitions, such as the area being lower or higher elevation than average.
Perhaps there is a line of trees nearby that block the wind, or maybe you’re closer to the nearby mountain than the weather station is, which means you may be more affected by an afternoon shade or a rain shadow.
In addition to finding out data through asking, you can do your own observations too. You might try putting minimum/maximum thermometers around your site in different places, and comparing the readings to see how the temperature ranges across your site.
Rain gauges in different places will do the same for rainfall. Observing the soil of your site may give you clues about erosion and patterns of water flow.
Some questions to ask about your site may include:
Are There Any Structures or Large Trees Nearby That Will Influence Sunlight Gathering?
Putting a solar panel in tree shade will reduce its effectiveness. Some plants might prefer to be shaded by a large tree during their growing season.
Are You at the Top or Bottom of a Slope?
Cold air tends to sink down a slope, and valley floors tend to be colder than hillsides. The steeper the slope, the sharper the temperature gradient is likely to be.
What Is the Solar Aspect of Your Installation or Plant?
Eastern morning sunlight is less intensive than western afternoon sunlight. South-facing installations receive much light day-round, whereas north-facing ones receive little light.
Are There Any Walls, Buildings, Hedgerows, or Fences That May Block or Redirect the Wind?
Is there perhaps infrastructure nearby that funnels wind at high speeds from a particular angle? High winds are dangerous for plants and will decrease the air temperature.
Are There Water Sources Nearby That May Reflect Sunlight More, Increasing Heat?
When the water is cold, does the wind blow colder air than usual onto your site? Water can act as a heat or cold sink, slowing temperature change across the seasons.
Sources of brick and stone can do the same – this concept is called ‘thermal mass’, and is determined by the speed at which heat energy flows into and out of different materials.
Microclimates can be studied on a level as small as a molehill, where the leeward side of the molehill may protect a tiny seedling that the windward side might not.
It can be possible to become bogged down in the details, but if you can intuit which climate factors on your site are likely to have the biggest microclimatic influence and account for those, you will have done the bulk of the work in this field already.
The microclimate factors most likely to influence my site are that the area I live in is higher than the rest of the town, making it warmer than some of the town.
It would be windier too, except for the protection of trees and fences in my neighborhood. There is likely to be high humidity based on the presence of these trees.
There is no running or standing water within at least a thousand feet of my home, which means that only the nearby trees might cool the summer air.
Many of the trees nearby are deciduous, which means that the shade effects will be more pronounced in the summer.
Design Considerations
It is recommended that you research your own site’s macro- and micro-climates in detail before implementing any major permaculture plans.
The more expensive or time-demanding your implementation will be, the more necessary it is that you front-load the research.
Each climate zone and microclimate zone has different considerations, and so, instead of listing them all here, here are some broad overview considerations to know:
Plants are adapted to different climate zones, and their biology reflects this. Desert plants reduce the surface area of their leaves, whereas plants that grow in water increase theirs. The plants you choose should be adapted to your broad climate zone.
In the humid tropics, he would orient his tall house to the prevailing wind direction, shade the house and garden with large trees, and describes the garden growth as being rampant and requiring a machete to control and harvest effectively. Soils are shallow and lose fertility quickly, and rains are heavy.
In the drylands, he would build his house low and flat, and insulate it well with thermal masses. Gardens on the shady side of the house are extra shaded and are in sunken instead of raised beds, to hold moisture and keep temperatures down.
Water features in the shade add to the effect of cooling the house further. On the sunny side, he suggests date palms, olive trees, and pomegranates to add shading.
In the colder humid lands, his house opens up to the sun, with large windows facing to the south, and a glass house on the south end of the house. The house’s windows are angled to optimize for the winter sun’s elevation.
On the shady side of the house, he recommends buffering cold winds with a windbreak of fast-growing trees. Raised beds, herb spirals, and ponds are suggested in the garden. Further out, coppiced wood lots provide fuel for heating.
As Geoff’s video suggests, different climate zones suggest different approaches to human housing. Concrete provides high thermal mass, and therefore may insulate people in temperate or continental climates.
Meanwhile, in tropical zones, wooden houses with a through-draught are better at staying cool and resisting mold.
Finally, animal breeds may be better- or worse-suited at thriving in a given climate zone, depending on where they are raised and transported to. For example, there are sheep that would be comfortable in North Dakota or Canada that would be far too warm for in South Florida.
Conclusion
Through a combination of researching your local climate, your USDA hardiness zone, your Köppen climate classification, and your local microclimates, you should by now have an idea about whether your permaculture plans are well-suited to your location.
Hopefully, through this research, you also gained some new ideas about what you may like to build, install, grow, and sell if your initial ideas might work in your zone, or work better elsewhere.
You also now have the tools, next time a neighbor or friend mentions the unusually warm weather, to remark that it’s within the eightieth percentile of temperature today and therefore not as warm as it could be.

David Dornbrack is a permaculture designer and author from the Austin area of Texas, USA. He first achieved his PDC in South Africa in 2013, and has since traveled to the world’s prototypical intentional community and ecovillage, Findhorn Foundation in Scotland. He has gardened in three different climate types – Mediterranean, Cold Temperate, and Humid Subtropical. His favorite plants are tomatoes, chilies, and potatoes. He believes that humans function best when interdependent – able to take good care of themselves so that they can be generous and giving to others. He would like to gain experience in house-building, carpentry, and solar electricity installation. Meet the rest of the team here.